During the post-communist transition period, Romania was host to several demographic trends, the succession of which was influenced both by economic conditions and European integration. In the 1990s, the intense urbanization of the communist era came to an end, with a limited re-ruralization of the population taking place: many cities experienced rapid declines in population, and the majority of the 1990s generation was born in rural areas. Communist-era factories went bankrupt, and the number of industrial workers decreased across the country. After the year 2000, a series of rapidly developing metro areas emerged, with a noticeable trend of seeing a rise in their share of the overall population. This phenomenon is not particularly visible in censuses, but it becomes apparent when analyzing regularly published data for housing construction, the emergence of job opportunities, the evolution of the school-age populations, etc.
To map the emergence of new demographic and economic concentrations and to identify counties with negative demographic prospects, at Rethink, we decided to develop a multi-criterial index. This allows the identification of the main economic and demographic trends using a basket of proxy data rather than relying on census data at face value. While traditional demographic data suffers from accuracy issues linked to the unprecedented mobility of the population or discrepancies between de facto residency and formal domiciles, the proxy data we chose better correspond to the reality “on the ground.” For example, the construction of new housing is much less affected by the risk of underreporting or overreporting. Even if there are some illegally constructed homes, these should be few given that legal registration is needed for the provision of utilities, services, etc. Some criteria we used also reflects potential attractiveness, for example the presence of university centers that act towards preventing the emigration of young people (to university centers in other counties). Others are non-demographic indicators that are usually associated with favorable demographic and economic developments (e.g. the number of employees). It is important to note that each criterion used has limitations and may be influenced by variations independent of demographic trends per se. The number of births can be influenced by fertility rate variations, the number of employees by increasing employment rates among the working-age population, and housing construction by the decrease in the average size of households or regional second home booms.
However, if several proxy criteria converge in the same direction (either positive or negative), they tend to reflect more general economic or demographic conditions in a county. The six criteria used, with their respective limitations, are:
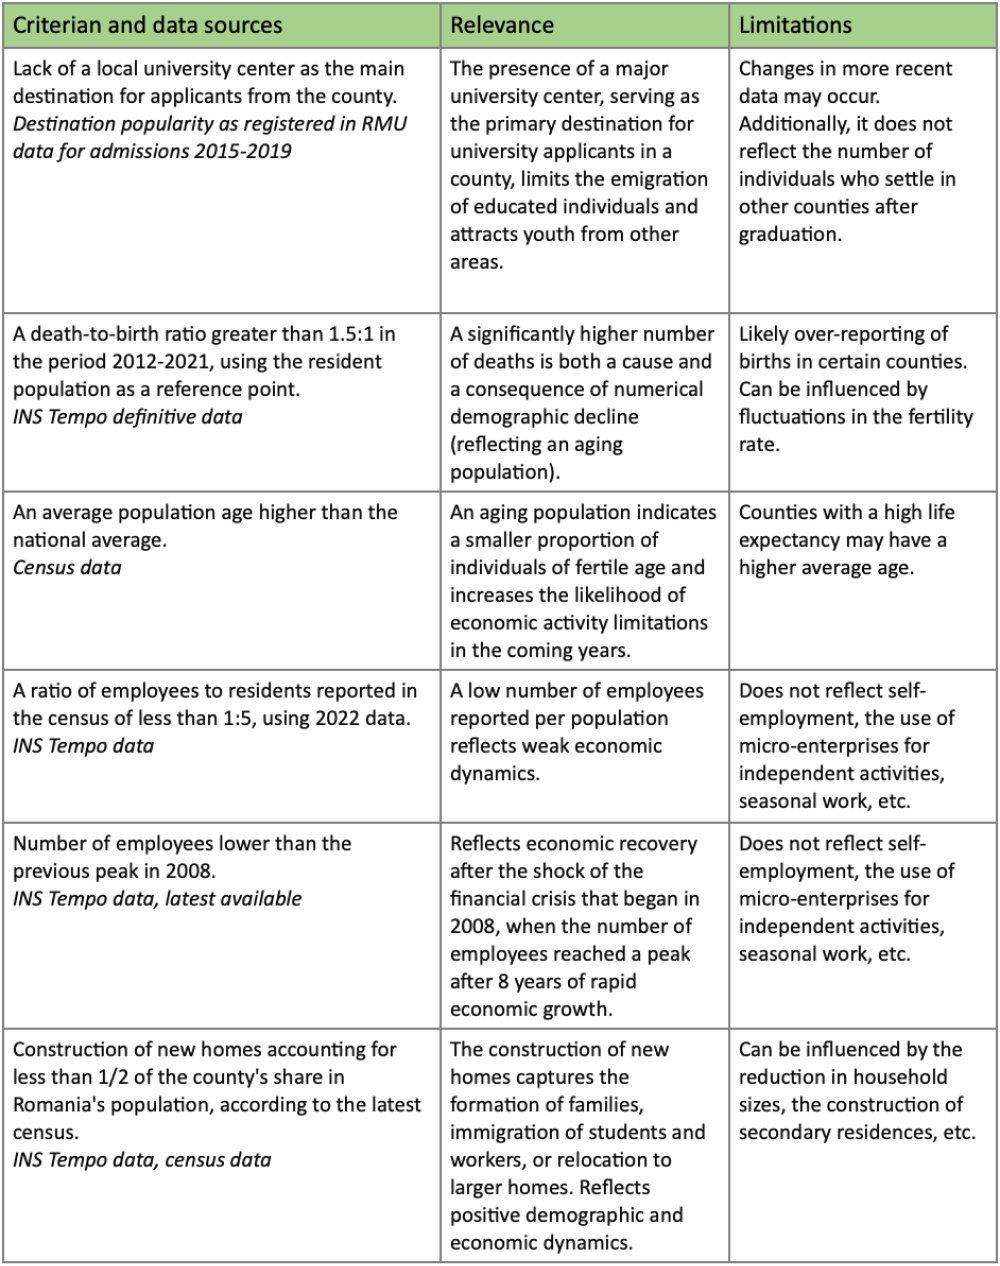
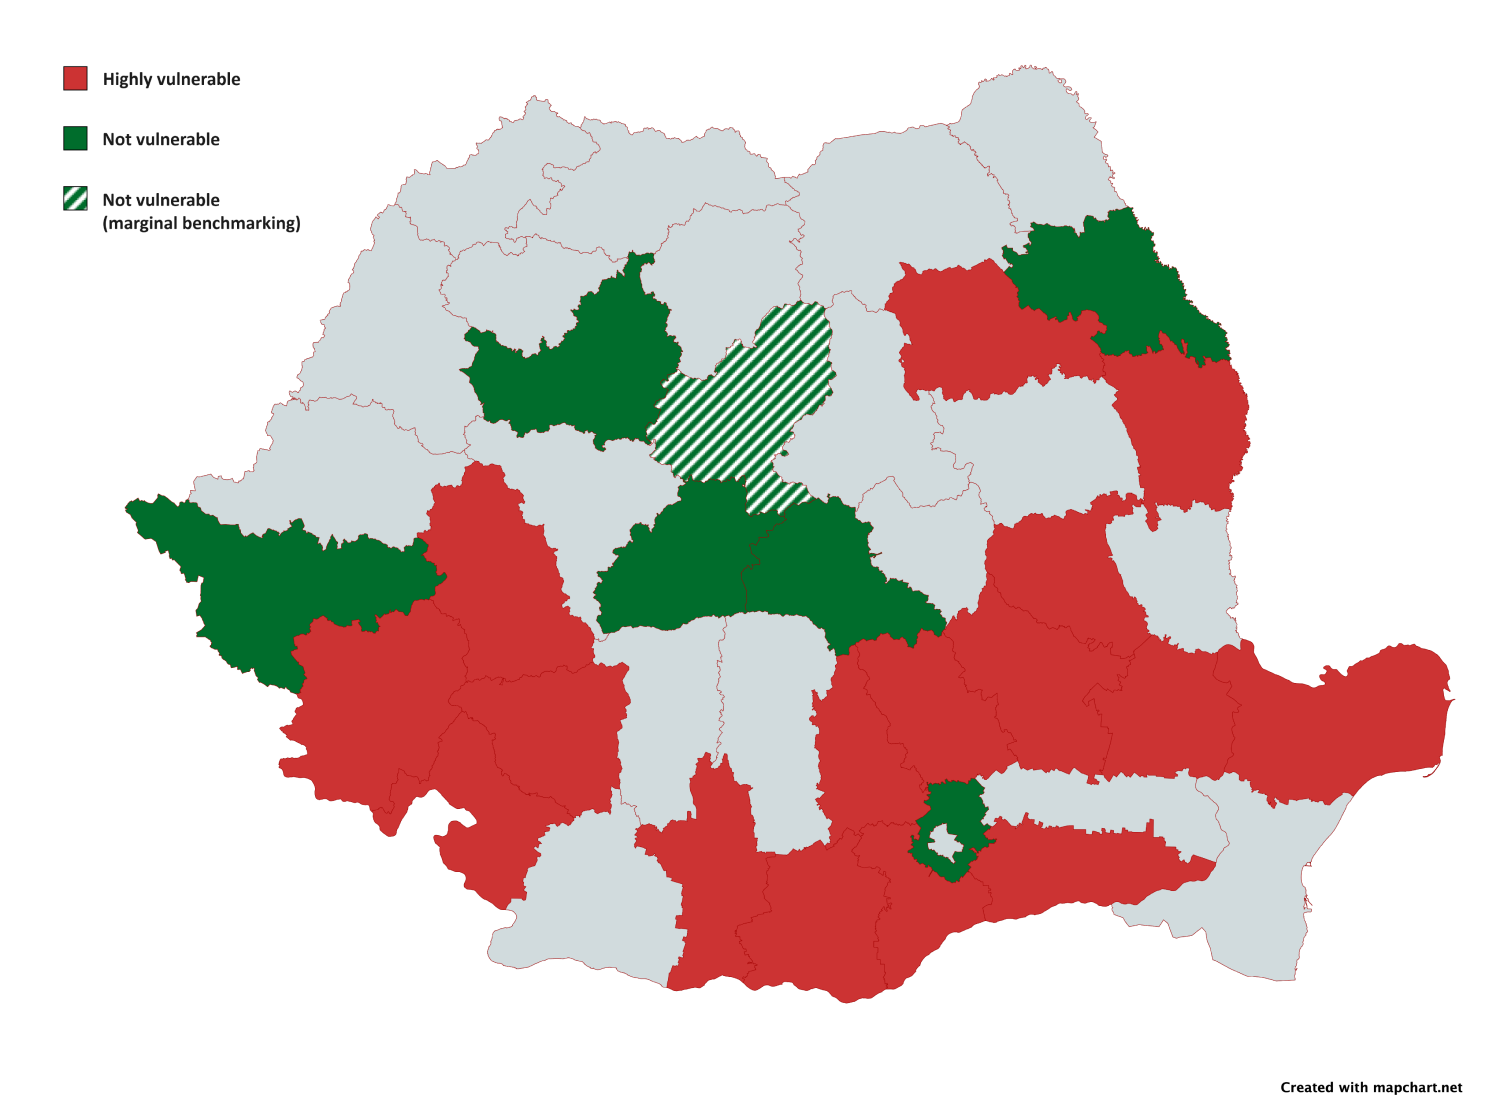
Counties that do not meet the benchmark for at least 4 criteria may be considered, in Rethink’s opinion, as “demographically vulnerable.” This implies negative long-term demographic prospects. On the other hand, we believe that counties that exceed all 6 thresholds have favorable prospects or at least the possibility of reversing negative demographic trends. Of the criteria used, Mureș County marginally meets three (employees, construction of homes, university-as-primary destination), which is why it appears shaded on the map below. Additionally, Bucharest “falls short” in the average age criterion, but this is influenced by suburbanization directed towards Ilfov County and the high life expectancy. Here, the unique administrative profile of the capital, formally separated from its suburbs, is the source of a statistical fluke.
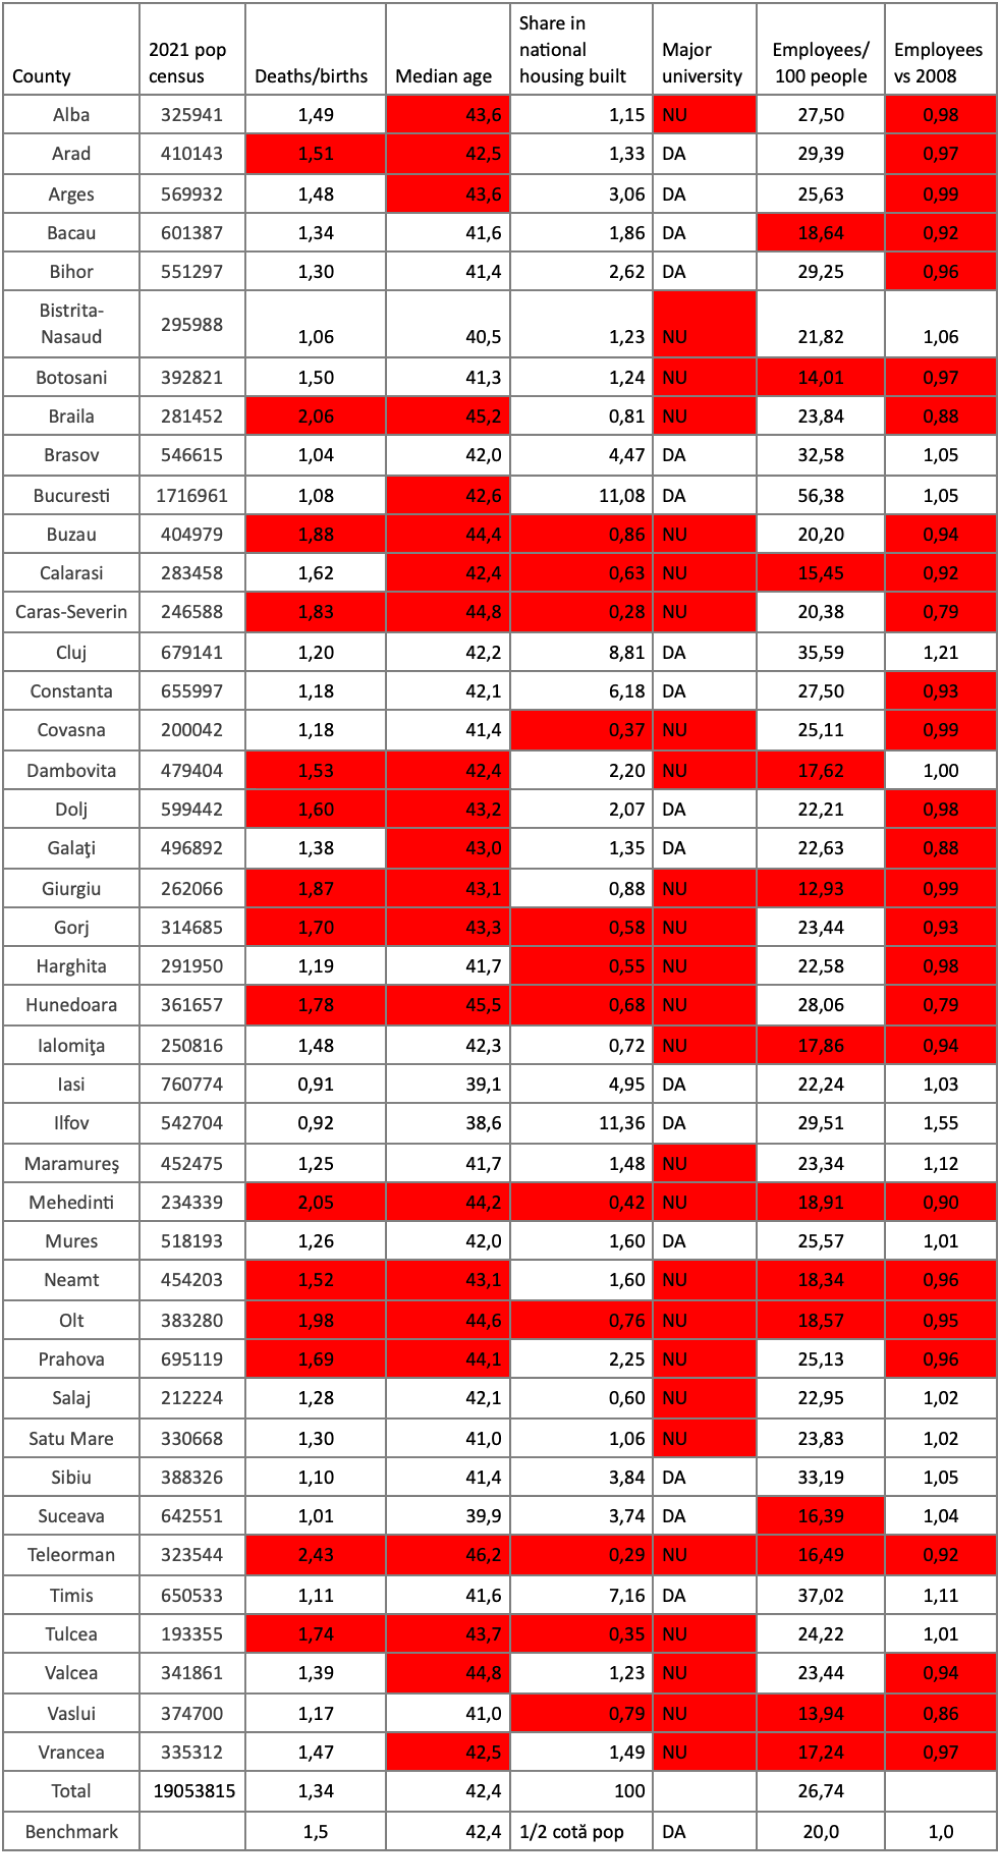
A detailed table shows how each county ranks for each criterion individually. It is important to note that some benchmarks are weighted at an arbitrary level below the national average. For example, those for housing and employees per 100 residents take into account the distorting effect of major hubs like Bucharest-Ilfov, Cluj, and Timișoara. Thus, for the housing criterion, the table indicates the proportion of newly constructed homes [in a county] out of the national total (2012-2021), but the threshold is met if this figure is higher than ½ of the county’s population share (nationwide) in the latest census.
Observations and conclusions
We observe that counties with a high level of demographic vulnerability are concentrated mainly in the southern and eastern regions. In the intra-Carpathian region, only Hunedoara and Caraș-Severin stand out. In the southern half of the country, the Bucharest-Ilfov area stands out drastically from the rest of the region. The Southern part of Romania contains the three counties that have not met the minimum benchmark for all 6 criteria (Mehedinți, Olt, and Teleorman). In the northeastern region, some demographic indicators are positive, but there is a low proportion of employees compared to the total population. It is difficult to tell whether this reflects the influence of labor migration to Western Europe or the prevalence of informal employment, but such contexts usually limit the attractiveness of the region for the economically active population.
In the medium and long term, public policies must consider that many vulnerable counties have demographic trajectories marked by a difficult-to-reverse downward slope. For some of them, decline management is the only viable solution, with a focus on ensuring minimum standards for the public services provided. There is a risk to opt for remedies based on educated hearsay, such as “infrastructure development will reverse trends”. But there is limited proof that throwing money at regions with steep, negative demographic trends does much to reverse the problem. The reason is simple: natural population decline works in geometric progression, “embedding” emigration and falling fertility rates into long-term variations.